

ERP Dashboard Analytics: Transforming Data into Actionable Strategies for Amazon Sellers
In the dynamic world of e-commerce, particularly for Amazon sellers, the role of data analytics and ERP systems cannot be overstated. It’s the compass that guides every strategic decision, from inventory management to marketing campaigns. Enter the Ailumia Dashboard, a beacon of insight. It’s more than just having data; it’s about understanding and utilizing this data to shape the future of your Amazon storefront 📊.
Understanding Dashboard Analytics
Dive into the Ailumia Dashboard, and you’re greeted with a comprehensive array of data points and analytics, meticulously crafted for Amazon sellers. Here’s a breakdown of its key features:
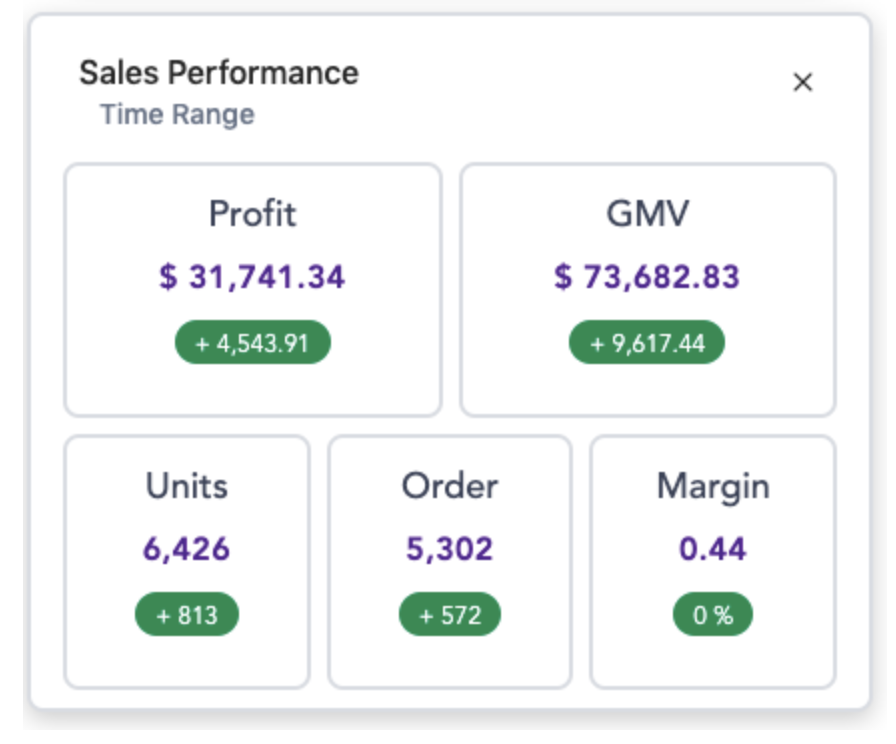
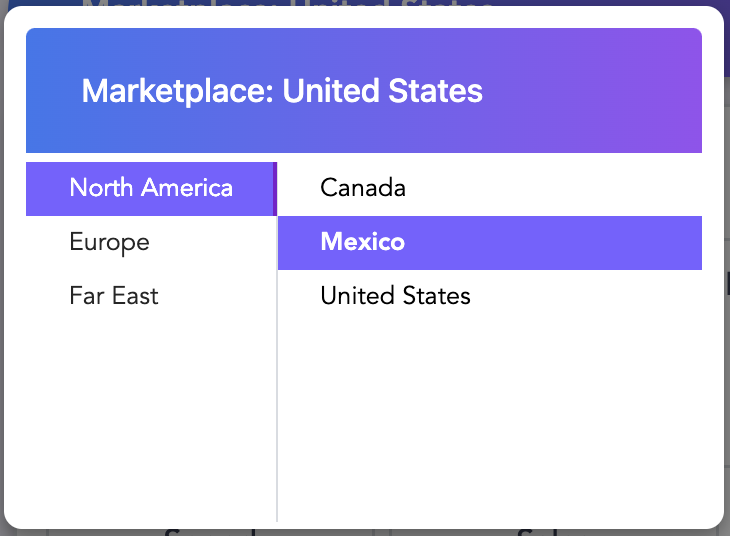
- Sales Performance Widget: A customizable tool that organizes performance data across various metrics. Sellers can filter by time period, marketplace, and account, enabling a laser-focused analysis of sales trends and patterns 📊.
- Business Performance Overview: The heart of the dashboard, offering an overarching view of your Amazon business’s health. It’s the starting point for understanding your venture’s current standing and trajectory.

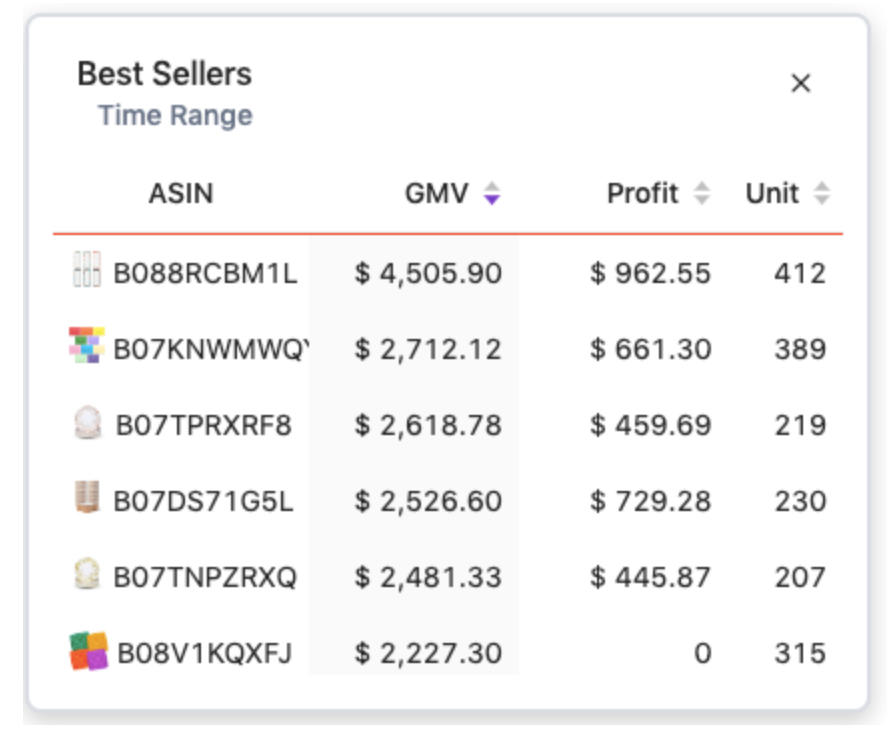
- Best Sellers Widget: This feature displays a sorted list of products based on Gross Merchandise Volume (GMV), including profit and units sold for each. It’s invaluable for identifying top-performing products and strategizing stock and marketing efforts accordingly.
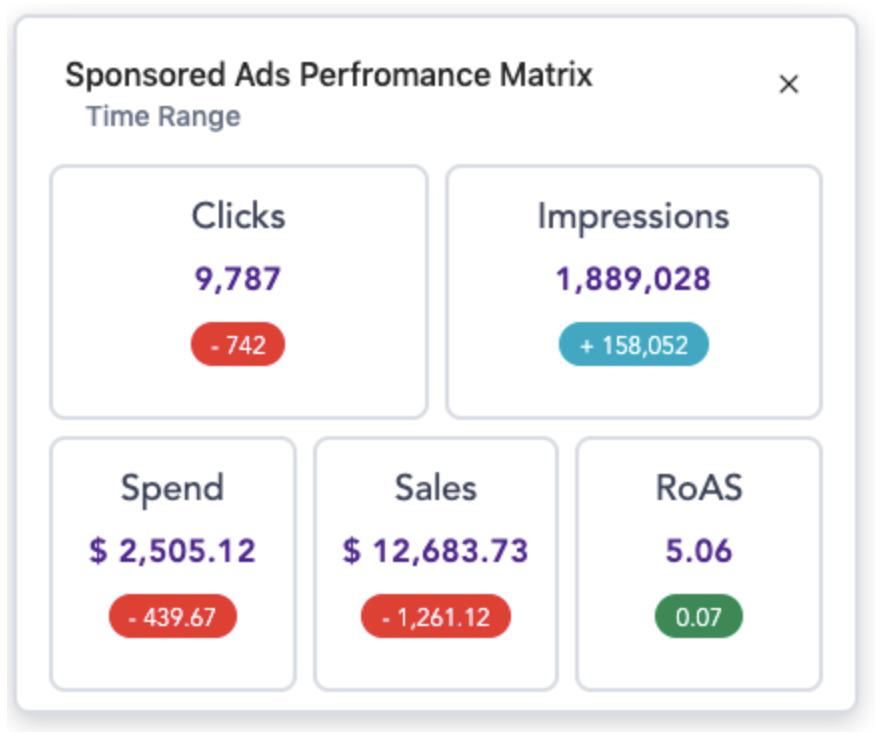
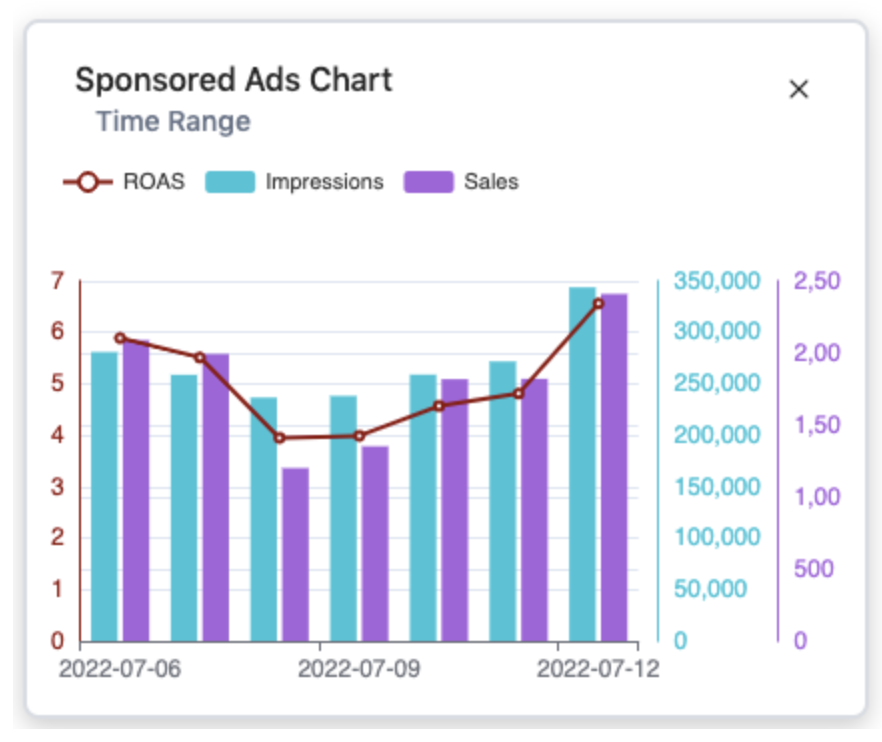
- Sponsored Ads Performance Metrics & Chart: Provides a bird’s-eye view of advertising effectiveness. Sellers can easily track ad performance trends, optimizing their advertising strategy for maximum ROI 💸.
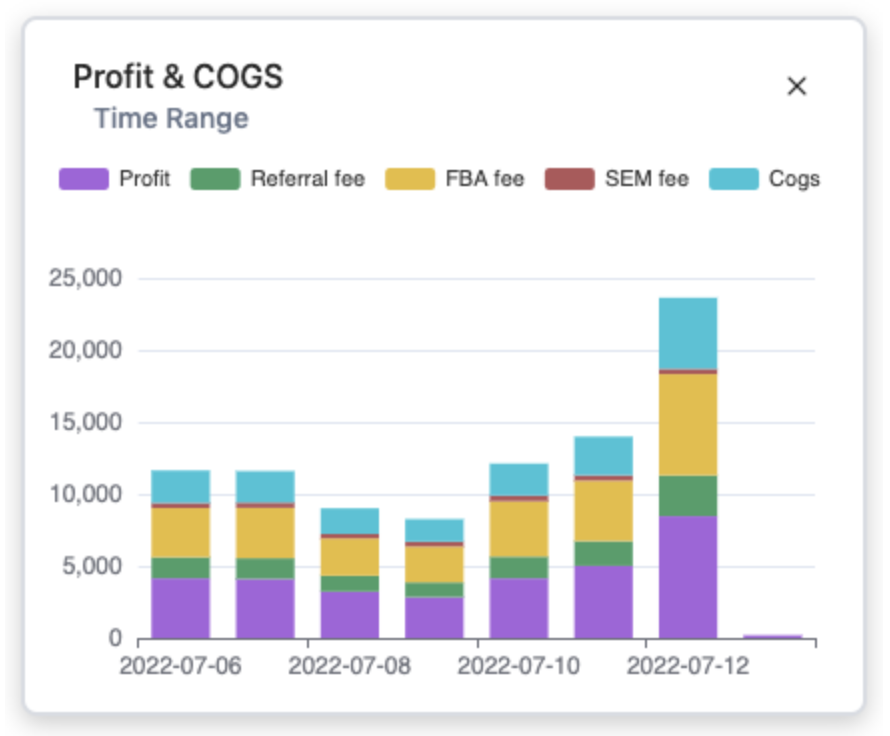
- Profit & COGS Widget: Breaks down sales into profit and expenses for each period, offering clear visibility into financial health and aiding in more informed budgeting decisions.
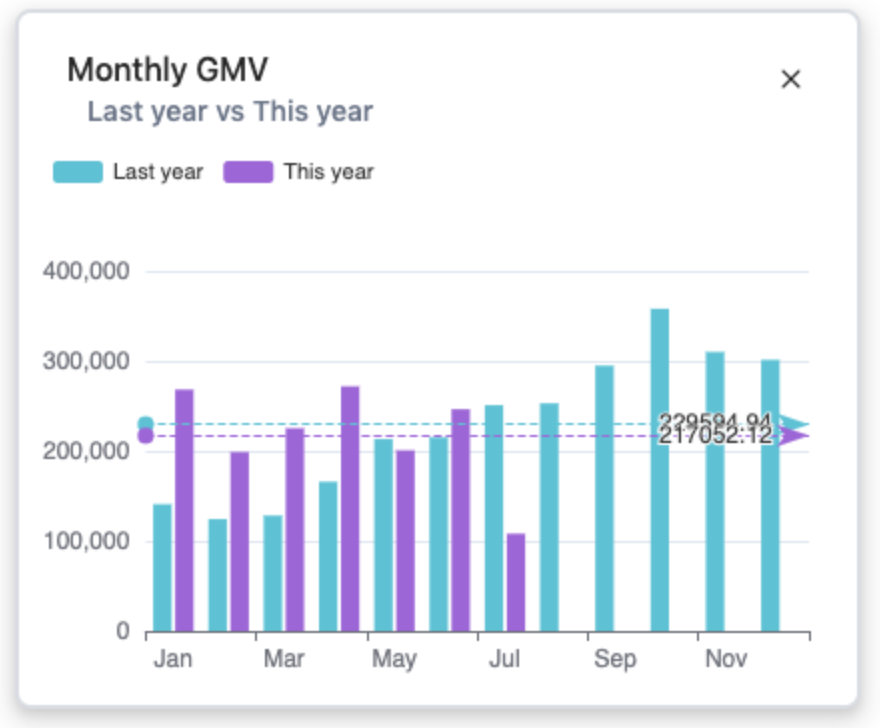
- Monthly GMV Widget: Allows sellers to compare current and previous years’ monthly revenue, perfect for spotting growth trends and planning future business moves 📈.
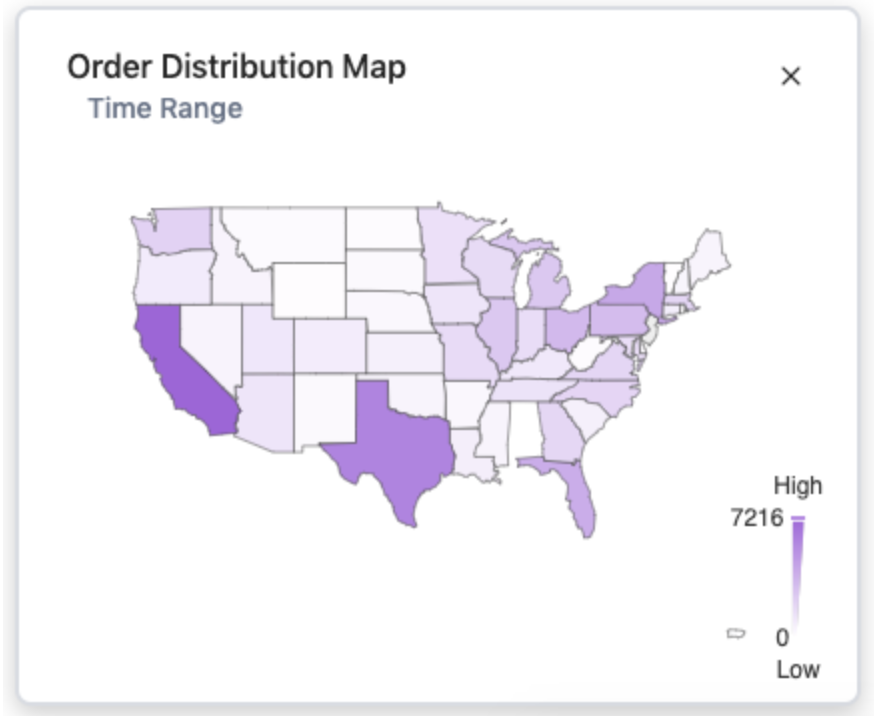
- Order Distribution Map: Visualizes the geographical spread of sales within a marketplace. Darker colors indicate higher sales volumes, helping sellers identify and target high-demand areas 🗺️.
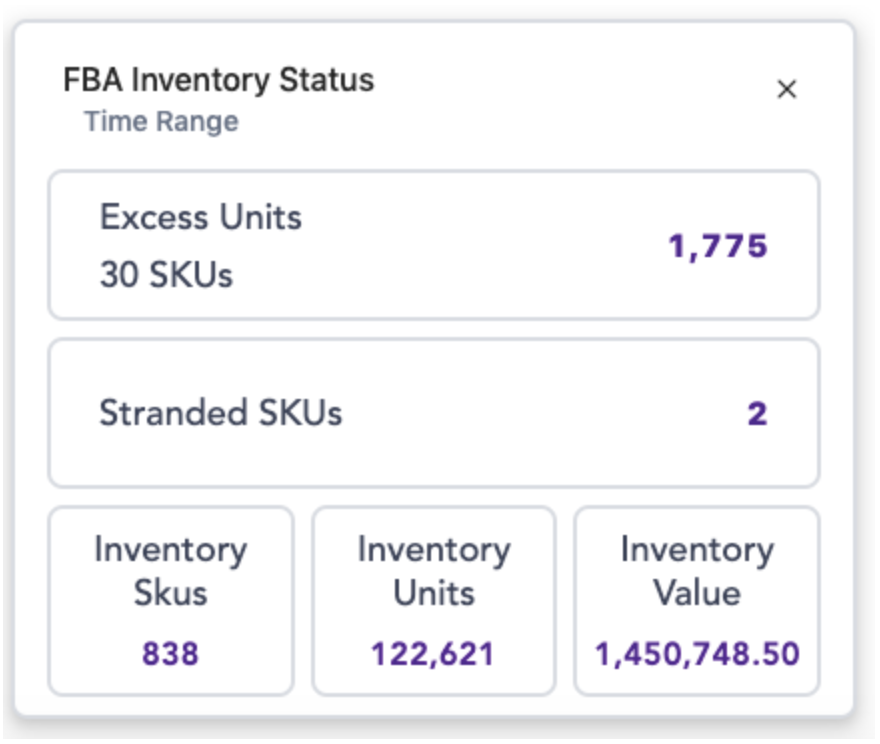
- FBA Inventory Status: Offers a quick snapshot of inventory health, with alerts for any anomalies. This feature is crucial for maintaining optimal stock levels and avoiding costly stockouts or overstock scenarios.
- Top 10 Best Sellers Widget: Showcases the top 10 best-selling products in an auto-scrolling slide, providing sellers with immediate insight into their most popular items.

Each of these features transforms raw data into actionable intelligence, enabling Amazon sellers to craft strategies that are both data-driven and result-oriented.
From Data to Strategy
How does one convert these analytics into actionable strategies? For instance, if the dashboard highlights a product experiencing a sales surge, an Amazon seller can leverage this trend by boosting stock levels or refining marketing strategies 🚀. Conversely, if a product is underperforming, the dashboard’s insights can pinpoint potential issues, transforming data into a strategic roadmap for success 🛣️.
Harnessing the Power of Analytics
By utilizing the power of the Ailumia Dashboard, Amazon sellers are empowered to make data-driven decisions that thrust their business forward. Embrace the data, decode the market, and catapult your Amazon business to new heights. Are you ready to revolutionize your Amazon journey with Ailumia’s analytics magic? The Ailumia Dashboard is waiting for you! 🌟